This is NOT about architectural styles or the art of designing buildings. It is about practical stuff when dealing with planning, construction, measuring, modelling of buildings.
See list of possible downloads at the end.
Purpose and assumptions
Especially in renovation and transformation projects one needs to get a fairly accurate plan of the rooms. This involves measuring the real stuff and then making a drawing, perhaps a 3D model.
Here is a series of steps that works well.
There is one assumption: that the walls of the rooms are straight and that they meet at right angles.
Measuring
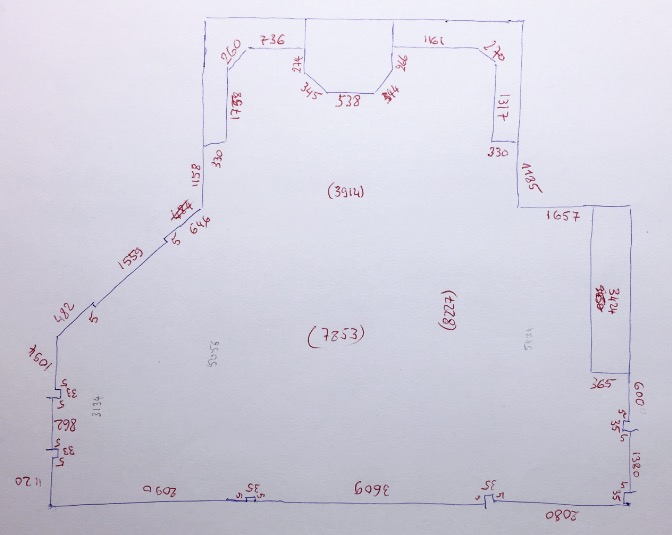
Begin with a hand drawing of the rooms. In the example only a single room is shown.
Draw all straight sections that are visible (blue line).
A rough hand drawing
Using a long enough meter, measure all sections to millimeter precision and note them on the drawing (red numbers). Preferably have a second person present, as they can help measuring the longer sections. Avoid measuring a length in multiple steps (get a long enough tape measure!). If you use a laser meter as well as a tape measure, then make sure they both give the same measure to the mm by measuring a long enough section using both systems. Generally laser meters work better over distances longer than a few metres and are unusable for lengths under 10cm, whereas tape measures are good between 10mm and 10m but not very easy to use for lengths less than 10mm.
Take a few measures across long distances, such as from wall to wall. That will make it easier to find errors later.
Check all measures, especially if the place is far from home.
Spreadsheet
Now use a spreadsheet to make a scatter graph that represents the room.
A scatter graph uses Cartesian x-y coordinates, so the measures now have to be translated into x-y pairs, but we only have increments (the distances from one point to the next).
Spreadsheet — Part 1
Make the table of increments dx,dy: pick a point of the hand drawing, say the bottom left corner. By agreement this point will have coordinates 0,0.
Now work clockwise from there around the walls. The first section goes straight up and is 1120mm long. The coordinates of its endpoint will be 0,1120, i.e. x has not changed and y has increased by 1120. Then there is a door frame, which sticks out by 5mm and is 33mm wide. That is, first x increases by 5 and y remains at 1120, then x stays the same but y increases by 33, and so on.
Thus, make a table with columns for these increments:
dx
dy
0
0
0
1120
5
0
0
33
-5
0
0
862
5
0
0
33
-5
0
0
1094
340.8
340.8
17.675
-17.675
1'102.2
1'102.2
-17.675
17.675
456.7
456.7
0
1158
330
0
…
…
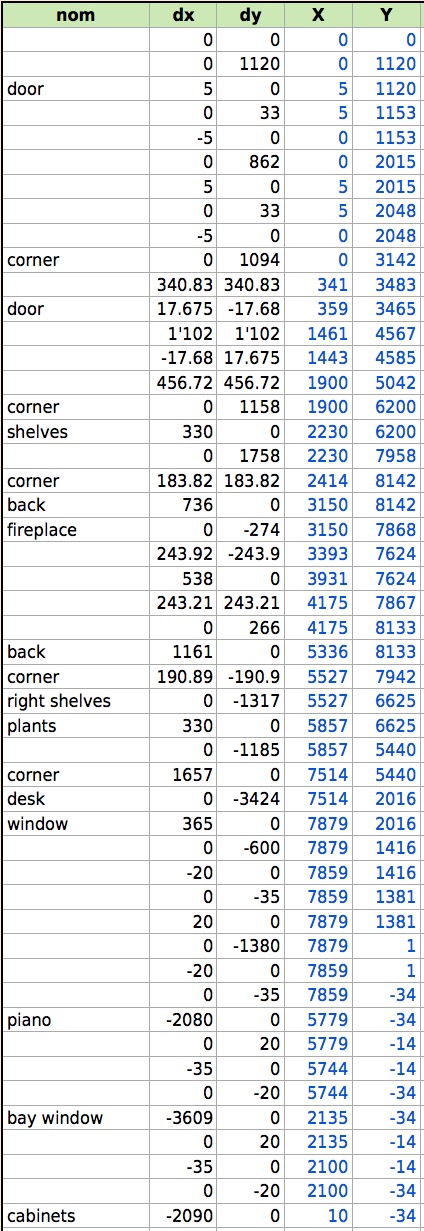
a partial table of the measurements
Reading this row by row: the first row gives 0,0 for the first point. Then x does not change (dx=0) but y goes up by 1120. Then x increases by 5 but y does not change (dy=0); then it goes vertically up again by 33 and then around the door frame, i.e. x decreases by 5. The door section of 862 follows and then the frame on the other side of the door. Then there is a straight section of wall of 1094mm long.
So far so good: each vertical section means dx=0 and each horizontal section means dy=0. Easy.
But in this example there are a few sections that are at 45º. For them, both x and y change, and they do so by cos(45º) = 0.707 times the section length. A spreadsheet can easily do this calculation; e.g. enter the formula =482×0.707 into the cell instead of just 482. The value that appears is 340.8 and in this case it appears in both the dx and the dy column of the next row.
After the five oblique sections there is again one straigt up, and so on.
If there are no oblique sections then filling in this table is really easy. If there are many oblique sections and they are not at 45º, then use two sticks of wood to lay out a right angle on the floor and measure the dx, dy directly.
Spreadsheet — Part 2
The dx and dy columns give the increases of the coordinates. The coordinates are cumulative sums of the differences. Make two more columns, called X and Y. In all cells except the first of the X column put the formula that adds the dx value to the value of the cell just above it, in each cell except the first of the Y column put the formula that adds the dy value to value of the cell just above it. These are relative references, as in this sample:
A
B
C
D
dx
dy
X
Y
1
0
0
0
0
2
0
1120
=C1+A2
=D1+B2
3
5
0
=C2+A3
=D2+B3
4
0
33
=C3+A4
=D3+B4
5
-5
0
=C4+A5
=D4+B5
6
0
862
=C5+A6
=D5+B6
7
…
…
=C6+A7
=D6+B7
a partial table of the measurements
and they can easily be propagated down the entire table. The resulting computation shows:
A
B
C
D
dx
dy
X
Y
1
0
0
0
0
2
0
1120
0
1120
3
5
0
5
1120
4
0
33
5
1153
5
-5
0
5
1153
6
0
862
5
2015
7
…
…
…
…
a partial table of the measurements
In the total table of the example an additional column at the left has notes so that it is easier to find errors (and they will occur!).
the coordinates computed by spreadsheet
Interesting Remark
At the very end the last point should coincide with the first point if every measurement was perfect. That is not the case, but the error is remarkably small: it is only 10mm off in x and 34mm in y after entering 50 points measuring a space of about 8 by 8 metres!
Spreadsheet — Part 3
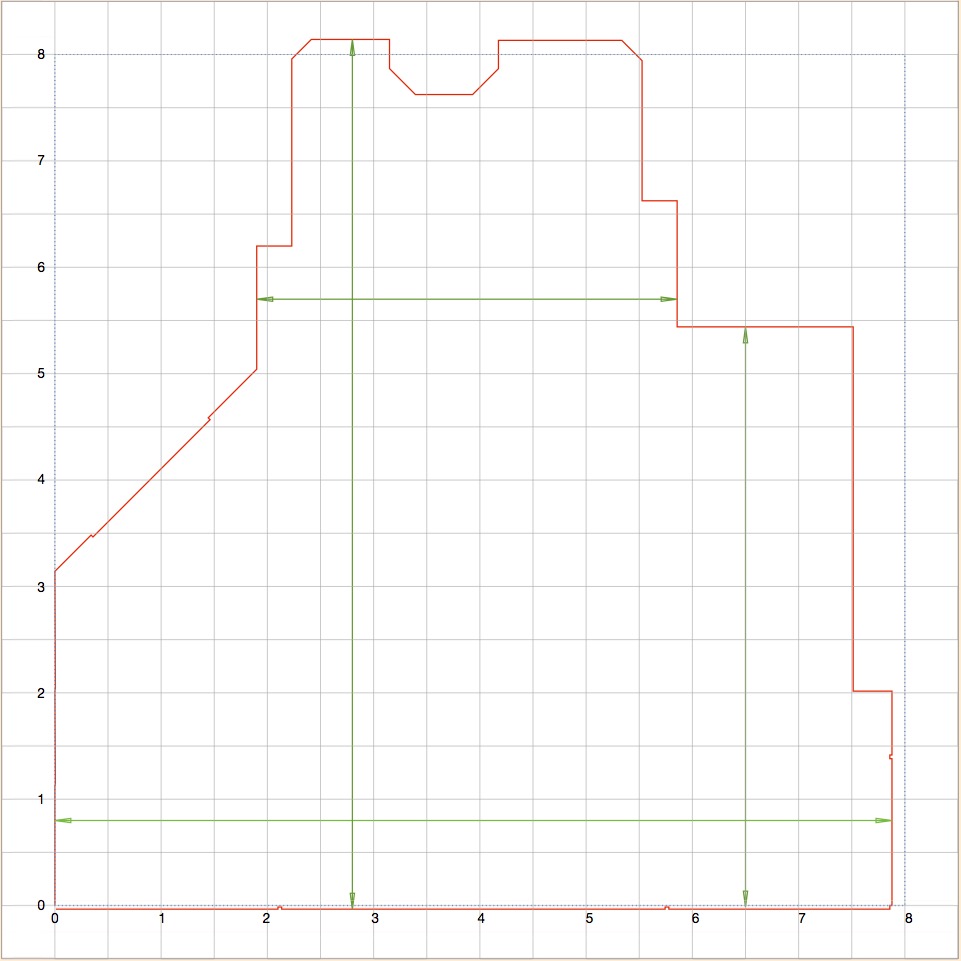
Selecting the to columns X and Y, create a scatter graph:
scatter graph
Depending on the spreadsheet software used, many parameters may need to be set: showing-hiding of axes and gridlines, minimum/maximum values, data point markers and lines between points and so on. The example used Apple's Numbers and is available for download.
A few measured lengths may now be adjusted or remeasured in order to let the last point end up at exactly 0,0 but this is minor tweaking.
Extra tables can be computed from the original one and scatter graphs added, e.g. the four green measuring lines in the example.
Make sure that in the graph a square is a square on the screen, i.e. that the units in x and y are the same. This probably means the minimum/maximum values of the axes have to be set or the entire graph resized.
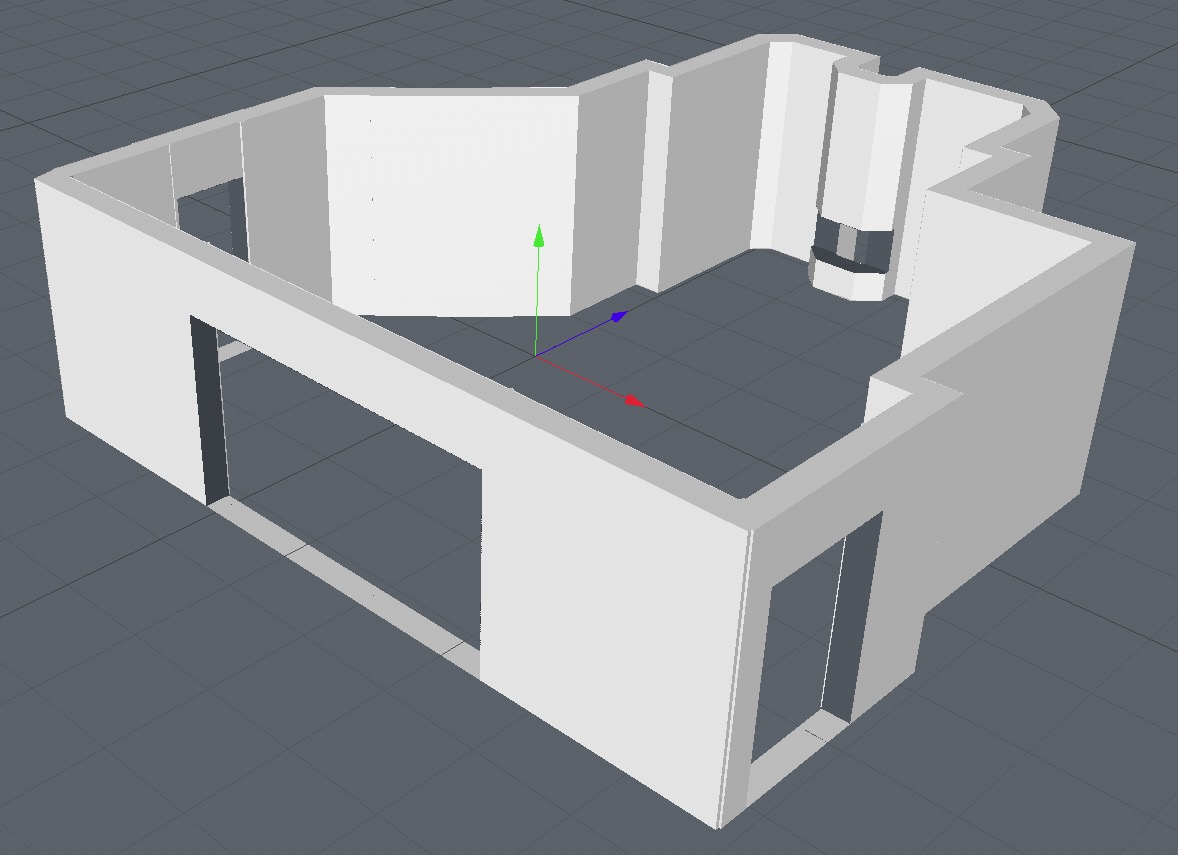
3D model
Again depending on the software used, the graph can now be exported to serve in a 3D modelling program. The following steps were used to make this first approximation model:
3D model
Export to vector graphics
In the spreadsheet, select and copy the graph.
Create a new document with a vector drawing program and paste. This worked between Apple Numbers and Affinity's Designer.
Delete all the extraneous parts such as axes and gridlines using the vector drawing program, keep only the room's outline (the original scatter graph).
Close the polygon. If possible, let the stroke sit on the outside of the polygon, stroke wide enough and expand the stroke. That will give a compound polygon that has the inside of the room but also gives thickness to the walls. It is of course possible to keep just the polygon shape and work with it differently in the 3D modelling program.
Export to 3D modelling
From the vector drawing program, export to some format that is understood by your 3D modelling program. EPS worked between Affinity Designer and Cinema 4D.
Make the 3D model
Import the intermediate file (EPS in the example) into a 3D modelling program (Maxon's Cinema 4D in the example). The polygon(s) may have to be rotated into the correct plane and some parameters set. If necessary scale the polygons to achieve a size that is commensurate with the units used in the modelling program.
Use an extrude operator on the polygon(s).
Create some blocks to use as openings for doors and windows, subtract them from the walls.
Surfaces
The spreadsheet can compute the surface area by adding a single colum.
The line enclosing the area is a polygon. It is constructed of straight line segments. Consider:
The area enclosed between a line section AB and the x-axis is a simple trapezoid. Its surface is
(XA-XB)(YB+YA)/2
This is a positive number if AB goes from left to right, and negative when it goes from right to left.
Since the polygon is closed, summing of all the areas below the segments will leave the value of the surface enclosed in the polygon, though the result may be a negative number.
Consider the polygon ABCDEFG in the figure below. The areas below the segments AB, BC, …, EF will be counted positively, then those below FG, …, HA will be negative, and thus the sum will be the area left inside, which is what is desired.
the area inside a polygon
The coordinates of the segment end points are already in the spreadsheet columns. Make an extra column with these formulae:
A
B
C
D
E
dx
dy
X
Y
surface
1
0
0
0
0
2
0
1120
0
1120
=(C2-C1)*(D1+D2)/2
3
5
0
5
1120
=(C3-C2)*(D2+D3)/2
4
0
33
5
1153
=(C4-C3)*(D3+D4)/2
5
-5
0
5
1153
=(C5-C4)*(D4+D5)/2
6
0
862
5
2015
=(C6-C5)*(D5+D6)/2
7
…
…
…
…
…
a partial table calculating surfaces
Again, the formula can be written once and propagated down the rows.
Caveat: as you discover mistakes in the dx,dy pairs, you may have to add or delele a row here and there. The formulae computing the X, Y and surface must then be propagated again over the rows.
The values of the surface column must be summed. The sum is in mm2 so it must be divided by 1'000'000 to yield m2.